Not sure if this or the Tools subforum is the right place for this question, but here goes…
I would like simple instructions on how to change the color of a plot line in a screenshot of a graph, preferably using free software (for either Windows or Kubuntu Linux). As an example, consider the graph below:
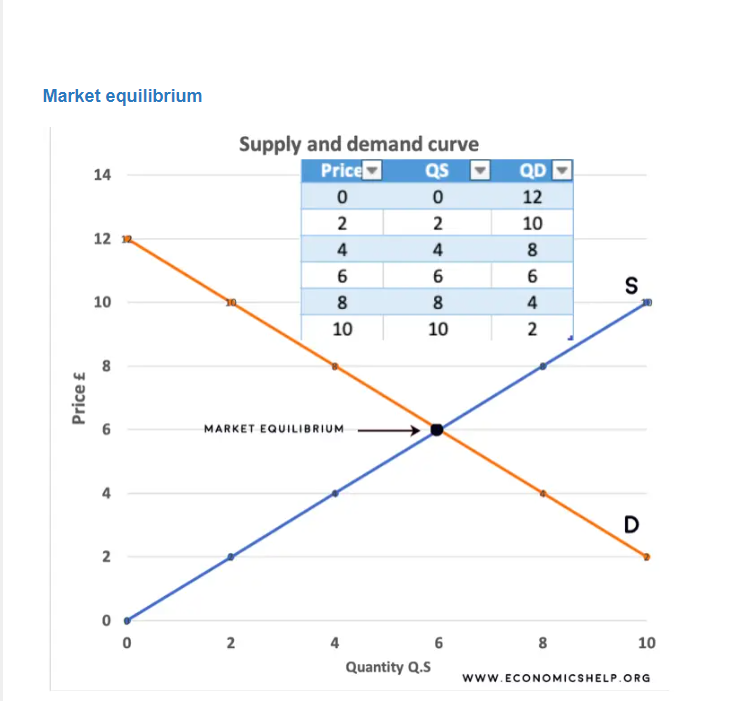
[Source]
Suppose that I wanted to change the orange plot to green, and the blue plot to red. Is there a simple way to do that in any free graphics software? Microsoft Paint can’t do it. In Linux, I’ve tried GIMP, Krita, and Dia, but I’ve looked at their user manuals and it’s totally disproportionate to go through a graduate-level course in graphics jargon–“layers” and “filters” and “masks,” oh my!–to do what seemingly should be a straightforward procedure that I only need to do once in a blue moon. (Meaning, by the next time I’d have to do this, I would have forgotten the details of the user-manual dissertation and would have to review it all over again.)
I’ve also come across YouTube videos that claim to show you how to do this, but for heaven’s sakes they’re like multi-part, half-hour episodes.
Hoping for a step-by-step description in a program that I can use. It really shouldn’t have to be that hard to tell a program to just select the blue plot line and change it to red.